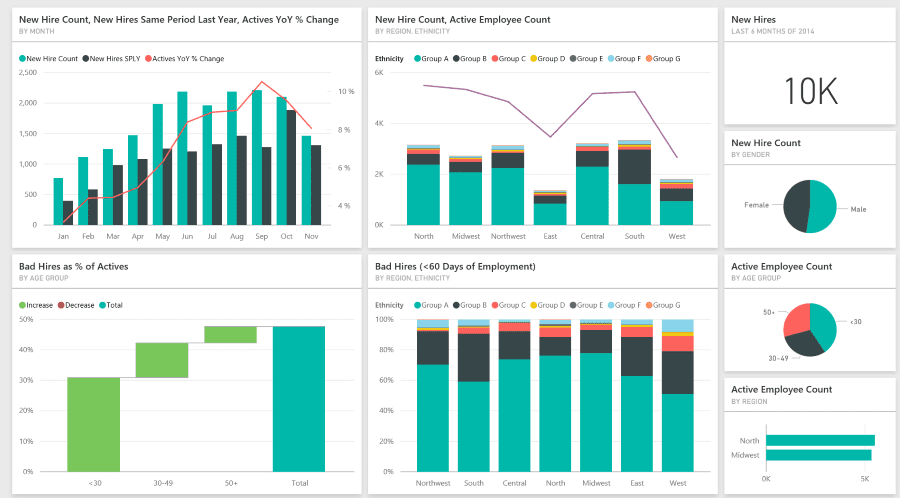
You can display charts from Power BI with our new widget
We have developed a new widget with which you can simply connect Ki-Wi Signage with Microsoft Power Bi. You can then display interactive charts, reports, or dashboards that are loaded from Power BI.
To make everything work you just need to connect the new Ki-Wi BI widget with Power BI source data and then designate (using ID parameters) which report or dashboards should be displayed on your screens.
You can
- launch the widget alone (displaying only one selected chart),
- set it as a part of a template (there is other information on the screen besides the chart, such as weather, calendar and so on),
- or multiply it (there are several charts and dashboards from Power BI at the same time).
Charts and reports from Power BI serve good for internal communication (business results display in an office) as well as in production (e.g., information about production progress).
Complete documentation, including manuals, can be found on our documentation portal.
If you are interested in Power BI widget, please contact our sales department.